NIFTY Analysis for September 9, 2024 and Pre-Market Data
NIFTY Analysis for 09-09-2024 and Pre-Market Data
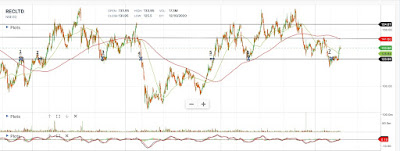
In today's daily chart, NIFTY formed a large red candle, indicating strong bearish pressure. The index dropped by 293 points, reflecting a shift towards profit booking as investors responded to an imbalance near the all-time high. Additionally, the recent discussions around increasing the contract size of NIFTY have added pressure to current price levels.
Reports suggest that SEBI may tighten regulations in the derivatives segment to prevent retail investors from excessive speculation in options trading.
The market’s next move will determine whether today’s action signals a trend reversal or not.
The Indian stock market decline also followed similar trends in global markets. In the US, major stock indices fell overnight as investors became more cautious about risky assets, driven by concerns about the country's economic outlook.
Tomorrow's Analysis
In the daily chart, NIFTY took support at the 20 SMA and closed above it. If NIFTY opens with a gap down tomorrow, further declines to the 23,800 levels are possible. However, if it holds above this level, we could see the market expire above 25,000 levels next week.
- Major Support Levels: 24,600, 24,500
- Major Resistance Levels: 25,000, 25,100, 25,200
The PCR stands at 0.6150, with the maximum change seen at the 25,000 strike price, indicating a pessimistic outlook for the market.
Retail investor participation is quite high these days, so we may see specific movements once certain confirmation levels are reached.
Overall, the market appears to be in an overbought state, and the chances of further selling are high.
For personalized consultations, feel free to leave a comment on this post.


Comments
Post a Comment