Technical indicators that helps in technical stock analysis over long-term and short-term
1.Average True Range (ATR) Bands
J. Welles Wilder first
mentioned average true range in his 1978 book New Concepts In Technical Trading
Systems. Buy the product here .
Exits are indicated while using average true range bands via signals:
When the price drops below the lower Average True Range Band, it is time to sell a long position.
When the price moves above the upper Average True Range Band, short positions should be closed.
Setting up ATR Bands
There are two possibilities:
ATR Bands are shown on a price chart around the closing price.
Bands are exhibited in connection to high and low prices in high-low analysis.
See the video to get a clear cut
2.Accumulation/Distribution indicator
The accumulation/distribution indicator (A/D), a cumulative technical indicator, determines using volume and price whether a stock is being distributed or accumulated. The A/D metric looks for differences between the volume flow and the stock price. This sheds light on how robust a stock trends is. If the price is growing but the indication is declining, it means that there may not be enough buying or stockpiling volume to support the price increase, and a price decline may be on the horizon.
A rising A/D line generally aids in confirming an upward stock price trend, whereas a falling A/D line often aids in confirming a downward stock price trend.
How to use Accumulation/Distribution indicator in trend analysis for intraday trading?
The A/D indicator is
comparatively simple to comprehend. To begin with, make sure the chart you are
using is trending. Consolidating charts are not the best for A/D indicator.
You should check the default period being utilized second. It is generally advised that you utilize the default time-frame.
Finally, when the A/D indicator is heading higher, you should buy, and when it is moving lower, you should sell.
3.ATR trailing stops
ATR Trailing Stops are stock market indicators for setting trailing stop-losses using the concepts behind Average True Range, a metric for gauging market volatility.
The purpose behind ATR is to help traders set stop-loss orders more precisely by providing a guide to the average volatility of price movements over a specified period.
The daily price change
is examined, and the bigger of the following formulas is used to determine True
Range: (high - previous close), (previous close - low), or (high – low). When
it comes to ATR Trailing Stops, the Average True Range is the calculation of
the True Range over an average of a default 21-day period.
4.ADX indicator
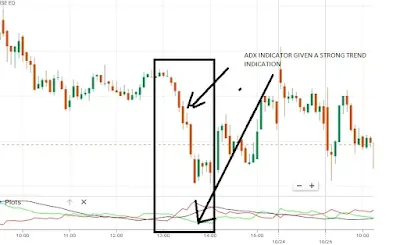
When the price is substantially trending, the average directional index (ADX) is utilised to determine this. It serves as the best trend indicator in many situations. Calculations of ADX are based on a moving average of price range expansion over a certain period of time. In addition to the basic configuration of 14 bars, other time periods can be used. With numbers ranging from 0 to 100, a single line is shown to indicate ADX. Since ADX is non-directional, it assesses the strength of both upward and downward stock price trends. The indicator and the two directional movement indicator (DMI) lines are typically plotted in the same window. Prices are rising when the +DMI is higher than the -DMI, and ADX gauges how strong the uptrend is. Prices are trending downward when the -DMI is above the +DMI, and ADX gauges how strong the downtrend is.
ADX value 0 – 25 indicates weak trend and value 75 – 100 indicates extremely strong trend.
5. MACD Indicator
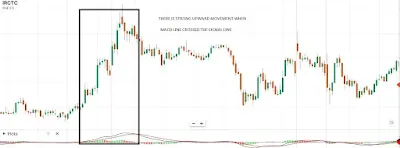
The relationship between two exponential moving averages (EMAs) of the price of a securities is displayed by the trend-following momentum indicator known as moving average convergence/divergence (MACD, or MAC-D). The 26-period EMA is subtracted from the 12-period EMA to calculate the MACD line.
When the MACD line crosses above the signal line, traders may buy the asset; when it crosses below, they may sell—or short—the security.
If the MACD is above
the signal line, the histogram will be above the zero line, or baseline, of the
MACD. If the MACD is below its signal line, the histogram will be lower than the baseline of the
MACD. The MACD's histogram is used by traders to determine whether bullish or bearish momentum is strong—and maybe overbought or oversold.
Technical indicators are tools used to analyze the stock trends and plan trades according to that. In this content a brief idea on some stock market indicators are mentioned. More content on detailed study of those indicators will be included in forthcoming contents.
Subscribe the page for receiving regular updates from this space.
Related topics : Nestle India Ltd – Weekly trending stocks – Down 52-week high
Learn Fundamental Analysis easliy : Fundamental Analysis
Earning money online is not hard as you think. Earn your first income online as a freelance writer . Click the LINK for registration.


Comments
Post a Comment