stock market technical analysis - ASI, Alligator and Anchored VWAP - Trading indicators explained
Technical indicators are calculations used by traders who follow technical chart analysis and are based on volume, price, etc. Stock market technical analysis is a trading discipline used to assess investments and spot trading opportunities by examining statistical trends gleaned from trading activity, such as volume change and price movement. Technical analysis is a trading discipline used to assess investments and spot trading opportunities.
To assess a security's strength or weakness, technical analysts concentrate on patterns of price movement, trading signals, and numerous other analytical charting tools.
Since technical indicators are made to examine short-term price changes, active traders frequently utilize them, but long-term investors can also use them to find profitable entry and exit opportunities.
In this section I am explaining some of the best trading indicators that you can use while doing technical analysis on stocks.
Table of contents
Accumulative swing index
Alligator
Anchored VWAP
1. Accumulative swing Index
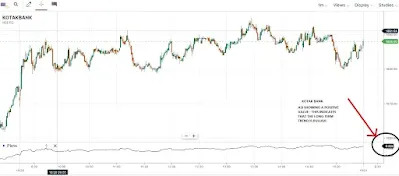
The ASI is used to obtain a more comprehensive long-term picture than the simple swing index, which uses information from only daily price points. The accumulative swing index has a positive value when there is an upward long-term trend. In contrast, the accumulative swing index has a negative value when the long-term trend is down.
The ASI was created as
a modification to the swing index. The chapter in Wilder's book, "New
Concepts in Technical Trading Systems," contains more information on ASI.
As the same trend-line must be broken in both scenarios, the ASI can be used in conjunction with trading channels to confirm breakouts. Typically, a positive ASI indicates that the long-term trend will be higher, and a negative ASI indicates that the long-term trend will be lower.
How to trade using ASI?
The ASI works best as a tool for verifying price
patterns. The ASI can be used by traders as a price signal to establish long
positions when the index value moves up or to close long positions and enter
short positions when the value moves down. A more distinct price indication can
be seen on a turbulent ASI chart than on a stable one. Take a look on the video shown below.
2. Alligator
A technical analysis indicator that makes use of smoothed moving averages is the Alligator indicator. The indicator begins by calculating a smoothed average using a simple moving average (SMA).
It employs three moving averages with periods of five, eight, and thirteen. The jaw, teeth, and lips of the alligator are represented by the three moving averages.
Jaw (blue line): Smoothed by eight bars on succeeding values, starting with a 13-bar SMMA.
Teeth (red line): Smoothed by five bars on succeeding values, starting with an eight-bar SMMA.
Lips (green line): Smoothed by three bars on succeeding values, starting with a five-bar SMMA.
When building trading signals, the indicator uses convergence-divergence relationships, with the Jaw making the slowest rotations and the Lips making the fastest.
The three lines should be kept apart and handled for long or short positions during trending times when they are moving higher or lower.
It is necessary to take profits and realign positions when indicator lines converge into small bands and move in a horizontal manner, which indicates that the trend may be ending.
When the three lines frequently cross each other owing to
rough market circumstances, the indicator will flash false positives.
3. Anchored VWAP (Volume weighted average price) Indicator
The acronym stands for "Anchored volume-weighted average price". With the Anchored VWAP indicator, the trader can associate VWAP computations with a particular price bar. It can be used to locate regions of support and resistance on the chart and, like the conventional VWAP, combines price and volume into a weighted average.
Anchored VWAP makes it simple to determine whether the bulls or bears have been in control since a very particular time period by allowing you to pick the price bar where calculations begin. A change in market psychology, such as a notable high or low, earnings, news, or other announcements, is typically signalled by the opening price bar that is picked. The price and volume information following that important occurrence are used to chart the anchored VWAP line.
How can we use it?
It is called VWAP because, like the name , it looks at the volume to make its calculation. The anchored VWAP line has a greater impact on higher volume spikes. From there, it calculates the average price of the stock and uses volume as a way to weight the average price.
Uses
The supply and demand indicator : The price is affected by the number of buyers and sellers, which is an indicator of supply and demand. The demand for the stock is higher than the anchored VWAP.
Support and resistance: As we look at the chart above, we can see the formation of support and resistance on VWAP.
In a long-term investment strategy, Anchored VWAP will show you where
to buy and sell securities.
Multiple indicators using simultaneously gives good results in technical analysis. After the completion of this technical indicators series you will be able to identify almost technical indicators and its applications.
Related topics :Short term trading strategy – Technical indicators Part 1
Learn fundamental analysis : Fundamental analysis
Read : Nestle India Ltd – Weekly trending stocks – Down 52-week high
Visit my YouTube channel Stock Market Trends and learn more on technical analysis
Earning money online is not hard as you think. Earn your first income online as a freelance writer . Click the LINK for registration.
“How to Avoid Loss and Earn Consistently in the Stock Market” An Easy-to-understand and Practical Guide for Every investor. Invest in your knowledge and you won’t regret.


Comments
Post a Comment